http://www.mathworks.com/matlabcentral/fileexchange/17748-windrose
The above image depicts a windrose. A windrose is used by meteorologists to give a short visual summary of how wind speed and direction are typically scattered at a specific location. The windrose above shows the wind blowing south west at speeds ranging from 5-20mph.
The above graph is a triangular plot or ternary plot. It graphically depicts the ratios of the three variables as positions in an equilateral triangle. It is used in many different srudies to show the compositions of systems composed of three species.
http://noelgirl.blogspot.com/2010/12/parallel-coordinate-graph.html
The graph depicted above is a parallel coordinate graph. Parallel coordinate graphs show a set of points in a common way of visualizing high-dimensional geography and analyzing multivariate data. The above graph displays the relationship of multidimensional data among variables.
http://quarknet.fnal.gov/toolkits/ati/histograms.html
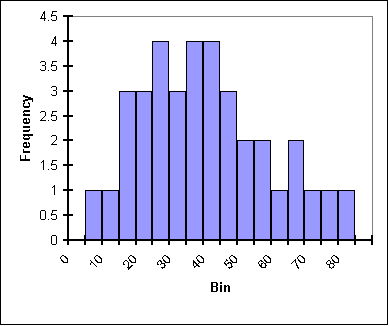
The above image shows a histogram. A histogram, similar to a bar graph, is a graphical representation showing a visual impression of the distribution of data. The above histogram shows the mass of a particle. The graph does not show a clearly defined peak or any sort of symmetry, giving the reader an imprecise and uncertain mass of the particle.
http://www.shmoop.com/basic-statistics-probability/stem-leaf-plots.html
The above image displays a stem and leaf plot. A stem and leaf plot is a device for presenting quantitative data in a graphical format to assist in visualizing the shape of a distribution. The above stem and leaf plot displays fifteen different numbers arranged in descending order on the stem side. The numbers interpreted by the plot are: 90, 94, 83, 84, 85, 87, 89, 79, 72, 72, 79, 65, 68, 69, 53.
http://tomcat.esat.kuleuven.be/txtgate/tutorial.jsp
The above image shows a similarity matrix. Similarity matrices are used in sequence alignment. Higher scores are given to more-similar characters, and lower or negative scores for dissimilar characters. This similarity matrix shows a group of human genes involved in colon and corectal cancer.
http://www.pnas.org/content/99/26/16597.full
The above post is a correlation matrix. A correlation Matrix is a matrix giving the correlations between all pairs of data sets. The correlation matrix above shows the calculated residue–residue-based correlated motions (dynamic cross-correlation map) "within a monomer of the HLADH from the 500-ps to 10-ns MD simulation of the HLADH⋅NAD+⋅PhCH2O−species."