http://amlcartography.sourceforge.net/chapter5/c5_2.html
This image shows a nominal area choropleth map. A nominal area choropleth map shows predefined aerial units. Usually a nominal area choropleth will have a graded color series, showing the different levels of intensity based off of a gradual color change from light to dark. The colors in the map above depicts different sets of data. A legend color coats and labels the data.
http://www.gallup.com/poll/106858/chinas-leadership-better-regarded-outside-west.aspx
The image above depicts a bilateral graph. Relative to a bar graph, a bilateral graph compares two or more variables side by side for a particular subject. This bilateral graph shows the percentage of people and their answers for the survey question, categorized in three different regions.
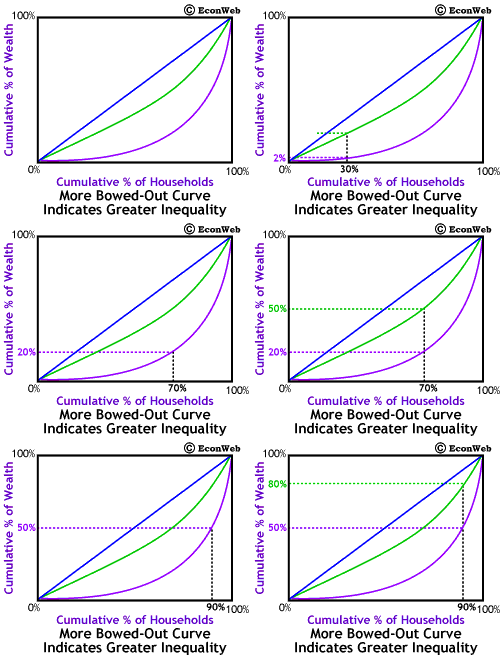
http://www.econweb.com/texts/current/Mansions/inequality-measure.html
This graph depicts a Lorenz curve. The Lorenz curve represents the cumulative distribution function graphically, showing the proportion of the distribution, often used in income distribution. This graph indicates the cumulative percentage of wealth relative to the cumulative percentage of households.
http://mohapl.dyndns.org/marketpred.html
Shown above is an Index value plot. An index value plot, has index values plotted instead of an actual numbers. Index value plots give a comparison, or normal, in order to base values off of. The above index value plot comes from the Dow Jones industrial average values depicting the return on the closing price.
http://www.co.nezperce.id.us/Portals/0/Planning%20and%20Building/ComprehensivePlan/fig_9-3.jpg
The graph above shows a population profile. A population profile is a graph that gauges a number of people and organizes them by their age. This population profile is depicted by a horizontal bar graph, showing the number of people from three different decades. The ages span from under 5 through 75 and over.
http://mrordovensky.edublogs.org/2011/12/20/all-classes-climograph-and-question-worksheet-due-tomorrow-quiz-thurs-1222/
The above image is a climograph. A climograph gives a visual description of the climate in a specific location. Temperature and precipitation can be gauged for a specific location and is shown on the graph. The above climograph shows the climate for Adelaide, Australia.
http://www.mathworks.com/matlabcentral/fileexchange/17748-windrose
The above image depicts a windrose. A windrose is used by meteorologists to give a short visual summary of how wind speed and direction are typically scattered at a specific location. The windrose above shows the wind blowing south west at speeds ranging from 5-20mph.